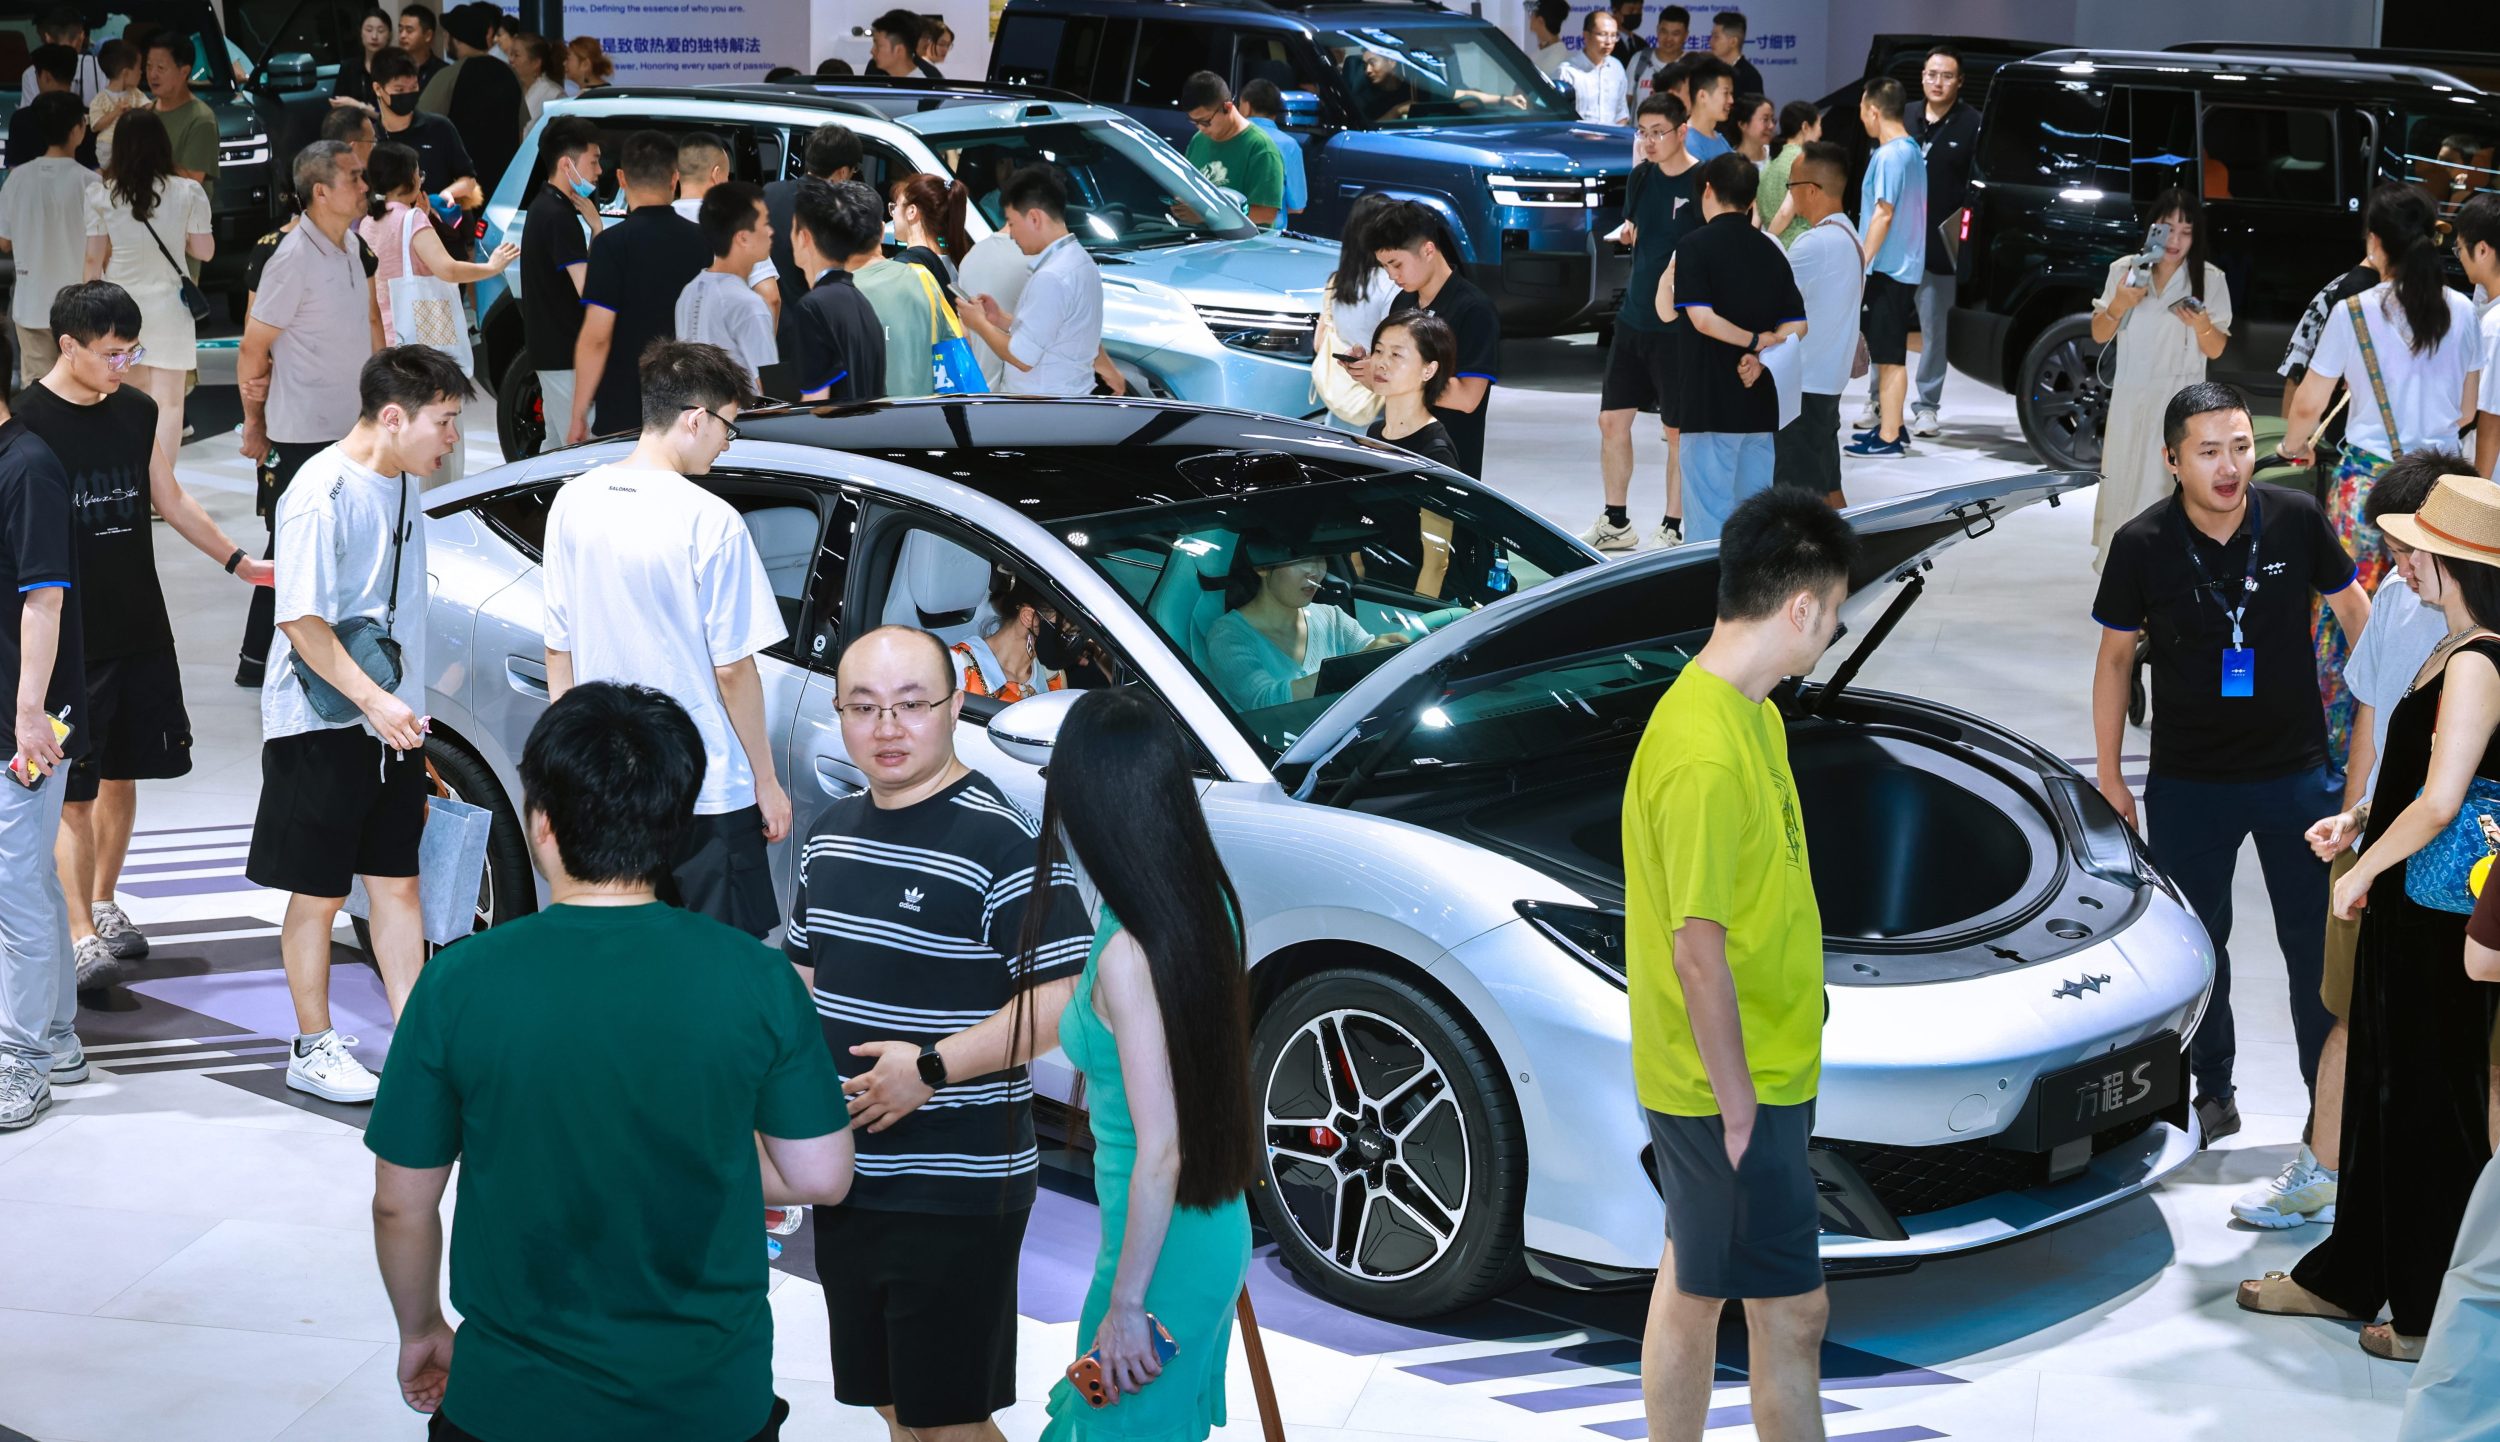
With the vehicle purchase tax exemption policy set to expire, the NEV market has seen a surge in traffic.
On November 19, the China Passenger Car Association (CPCA) released its latest weekly new energy passenger vehicle market data report for November 10–16, 2025.
Data shows that from November 1–16, nationwide new energy passenger vehicle retail sales reached 554,000 units, up 2% year-over-year and 7% month-over-month. Cumulative retail sales for the year-to-date totaled 10.703 million units, representing a 21% year-over-year increase.
During the same period, wholesale volume from manufacturers reached 618,000 units, up 1% year-over-year and 17% month-over-month. Cumulative wholesale volume this year reached 12.675 million units, a 28% year-over-year increase. The new energy vehicle penetration rate stood at 62.5% for retail and 60.6% for wholesale during the reporting period.
Overall, the impending expiration of the vehicle purchase tax exemption policy has generated a surge in market activity.
| Year / Metric | 1–9 Nov | 10–16 Nov | 17–23 Nov | 24–30 Nov | 1–16 Nov | Full month |
|---|---|---|---|---|---|---|
| 2023 | 43,195 | 56,934 | 60,551 | 124,070 | 49,206 | 69,321 |
| 2024 | 56,700 | 74,147 | 76,152 | 120,879 | 64,333 | 80,285 |
| 2025 | 46,056 | 67,312 | – | – | 55,356 | – |
| YoY vs same period last year | -19% | -9% | – | – | -14% | – |
| MoM vs same period last month | -4% | -7% | – | – | -6% | – |
In the first week of November, the average daily retail sales in the national passenger car market were 46,000 units. This represents a 19% year-on-year decrease compared to the same period last November and a 4% decrease compared to the previous month.
In the second week of November, the average daily retail sales were 67,000 units, reflecting a 9% year-on-year decrease and a 7% decrease from the previous month.
In the first week of November, the average daily wholesale figures from passenger car manufacturers were 52,000 units, marking a 22% year-on-year decrease but a 48% increase compared to the previous month.
In the second week, the average daily wholesale figures were 79,000 units, showing a 5% year-on-year decrease and a 4% decrease from the previous month.
| Year / Metric | 1–9 Nov | 10–16 Nov | 17–23 Nov | 24–30 Nov | 1–16 Nov | Full month |
|---|---|---|---|---|---|---|
| 2023 | 46,827 | 62,087 | 73,119 | 168,637 | 53,503 | 84,945 |
| 2024 | 66,737 | 83,480 | 93,587 | 155,718 | 74,062 | 97,671 |
| 2025 | 52,020 | 78,961 | – | – | 63,807 | – |
| YoY vs same period last year | -22% | -5% | – | – | -14% | – |
| MoM vs same period last month | 48% | -4% | – | – | 14% | – |
According to CPCA data, the comprehensive automobile dealer inventory coefficient in October was 1.17, down 13.3% month-over-month but up 6.4% year-over-year. Inventory levels have fallen below the warning threshold into a reasonable range.
Official forecasts estimate total dealer inventory at approximately 2.8 million units by end-October. By segment, premium luxury and import brands had an inventory coefficient of 1.15 (-19.0% MoM), joint venture brands 1.20 (-13.0% MoM), and Chinese brands 1.16 (-12.1% MoM).

Entering November, manufacturers and dealers have entered their final sprint to meet annual targets, with market demand expected to outpace October levels. The “Double 11” shopping festival, upcoming Guangzhou Auto Show, and concentrated new model launches will effectively boost year-end consumer enthusiasm.
Additionally, as the new energy vehicle purchase tax exemption policy will shift from “full exemption” to “half reduction” in 2026, automakers including NIO, Xiaomi, and Li Auto have introduced guarantee policies to secure orders. Combined with continued local subsidies and manufacturers’ year-end sales push, this is expected to sustain demand growth through the fourth quarter.
Discover more from ChinaEVHome
Subscribe to get the latest posts sent to your email.