China sold 31.08 million vehicles in the first 11 months, up 11% year on year, accounting for 35.4% of global sales.
On Dec. 30, Cui Dongshu, secretary-general of the China Passenger Car Association (CPCA), released the latest data showing that global automobile sales reached 8.59 million units in November 2025, up 1% year on year and 1% month on month.

From January to November, cumulative global auto sales totaled 87.66 million units, representing a 6% year-on-year increase.
Among major markets, China remained the primary driver of global automotive demand.
In terms of volume, China sold 31.08 million vehicles in the first 11 months, up 11% year on year, accounting for 35.4% of global sales.

This share was significantly higher than that of the United States at 17.3%, India at 5.8%, and Japan at 4.8%.
Monthly data underscore China’s growing weight. In November, China’s share of global auto sales rebounded to 40%, up 1 percentage point from a year earlier and 2 percentage points higher than in October.
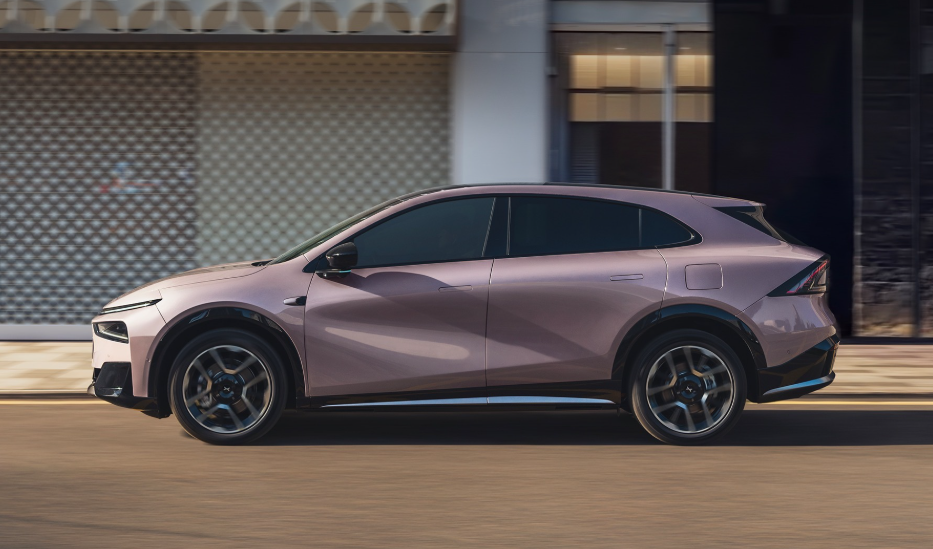
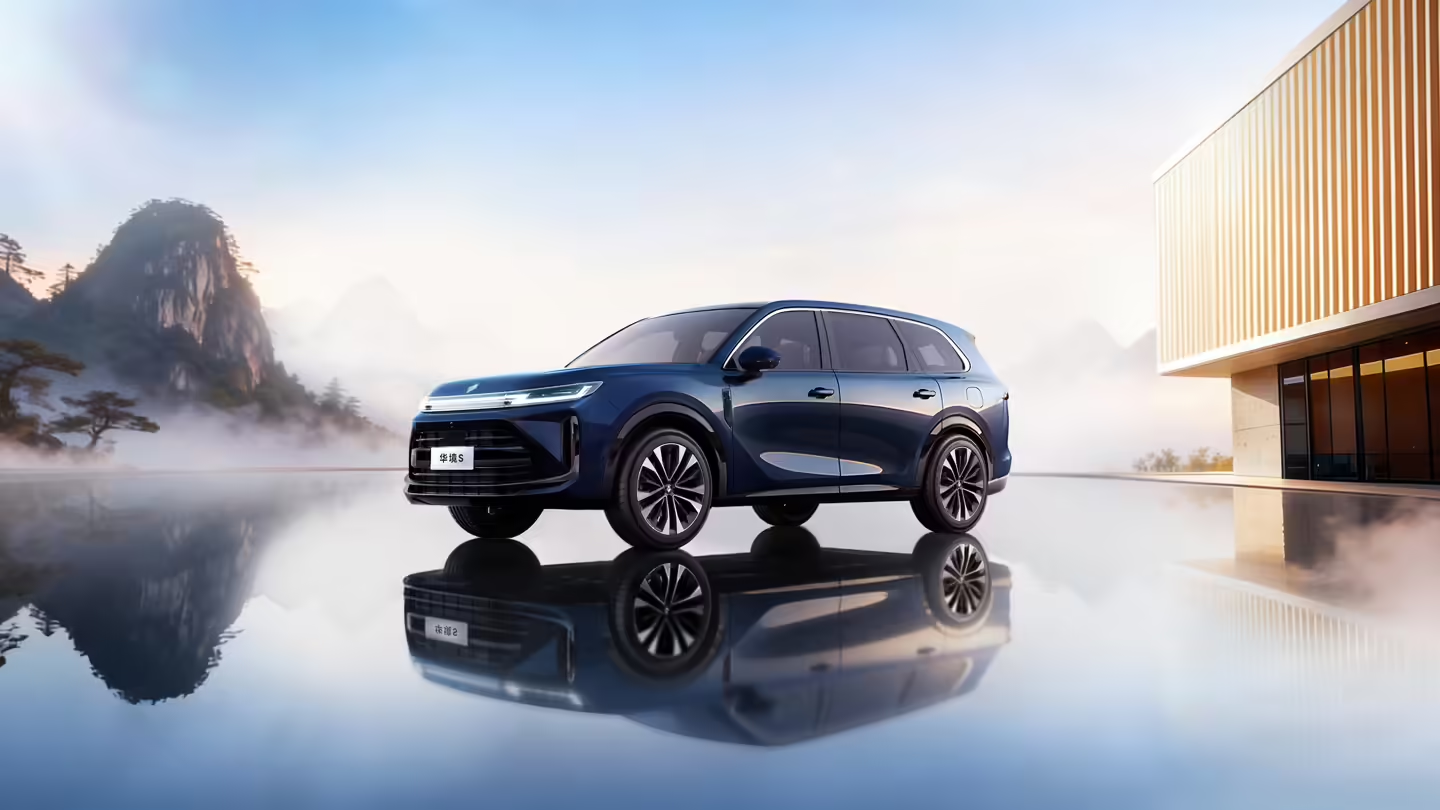
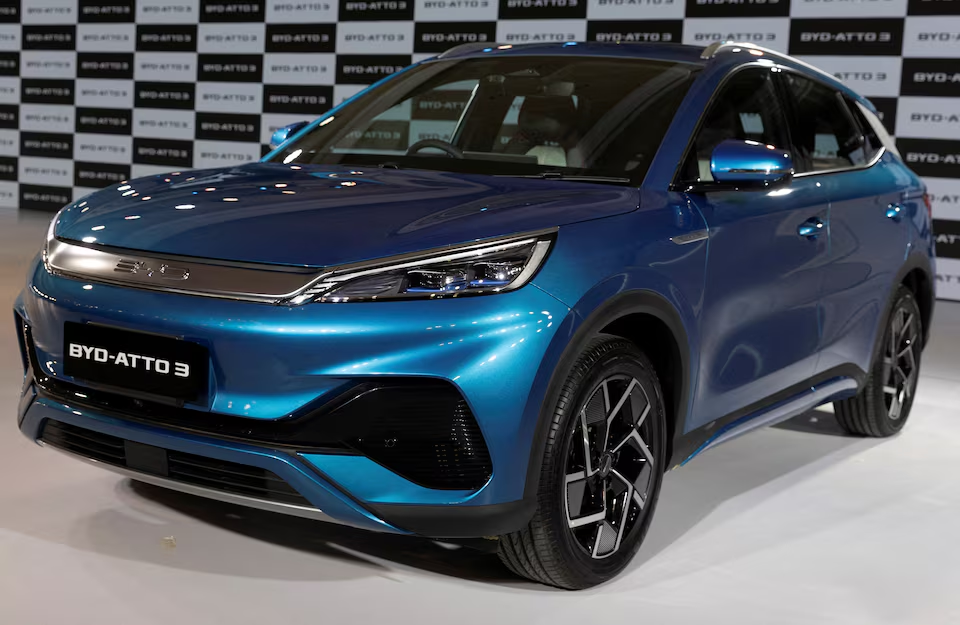
Among the world’s top 10 automotive groups in 2025, three Chinese automakers saw notable gains in market share.
BYD ranked sixth globally, Geely eighth, and Chery tenth, with global market shares rising to 5.3%, 4.6%, and 3.7%, respectively.

By contrast, automakers such as SAIC, Changan, GWM, FAW, Leapmotor, XPeng and Li Auto posted relatively stable overall performance during the period.
Overall, Asian automakers performed strongly from January to November 2025. Toyota Group maintained its position as the world’s largest automaker with an 11% global share, supported by steady performance in Europe and North America. Hyundai Motor and Suzuki also delivered broadly stable results.

In contrast, several European and U.S. automakers saw clear declines in market share. Volkswagen Group fell to 8.9%, while Stellantis, Renault-Nissan and Tesla declined to 5.6%, 5.4% and 1.9%, respectively.
The CPCA noted that as growth in the Chinese and U.S. markets slows, overall expansion in the global auto market moderated in November. Based on current trends, global vehicle sales in 2025 are projected to reach around 96 million units.
In China, domestic demand is gradually returning to normal, while a recovery in exports and improving competitiveness of domestic brands continue to lift the country’s share of the global auto market.
Discover more from ChinaEVHome
Subscribe to get the latest posts sent to your email.